How to Develop Analytical Skills A Complete Guide
Sharpening your analytical skills isn't a one-and-done deal. It's a constant process of tweaking how you see, question, and make sense of the world around you. At its heart, it’s about getting good in four key areas: critical thinking, data literacy, practical application, and clear communication. And no, this isn't just for data scientists—it's a must-have for anyone who wants to untangle complex problems and make a real impact.
Why Analytical Skills Matter More Than Ever
In today's whirlwind professional environment, the ability to think analytically is what separates someone who just follows instructions from someone who truly solves problems. It’s the difference between doing a task and understanding why that task even matters. That’s the kind of thinking employers are hungry for.
There's a reason analytical skills are one of the hottest tickets in the job market. A staggering 60% of employers worldwide now point to critical thinking as a top priority when they're hiring. This makes perfect sense when you consider that jobs demanding strong analytical chops have been growing by more than 20% annually since 2018.
The Shift From Following To Leading
When you nail your analytical skills, you stop waiting for problems to land on your desk. You start seeing them coming. You spot hidden opportunities, connect dots others miss, and pitch solutions backed by solid evidence before anyone even asks. It's about turning raw info into smart action.
This proactive mindset is a career accelerator. Digging into the world of upskilling for career advancement really drives home why this is so critical for getting ahead. It's a cornerstone of any solid professional development planning strategy.
The real power of analytical thinking isn't just about finding the right answer; it's about asking the right questions. It's the engine that drives innovation and strategic decision-making in any role.
This infographic breaks down that journey perfectly, showing how you move from a task-doer to a value-driver by building these core skills.
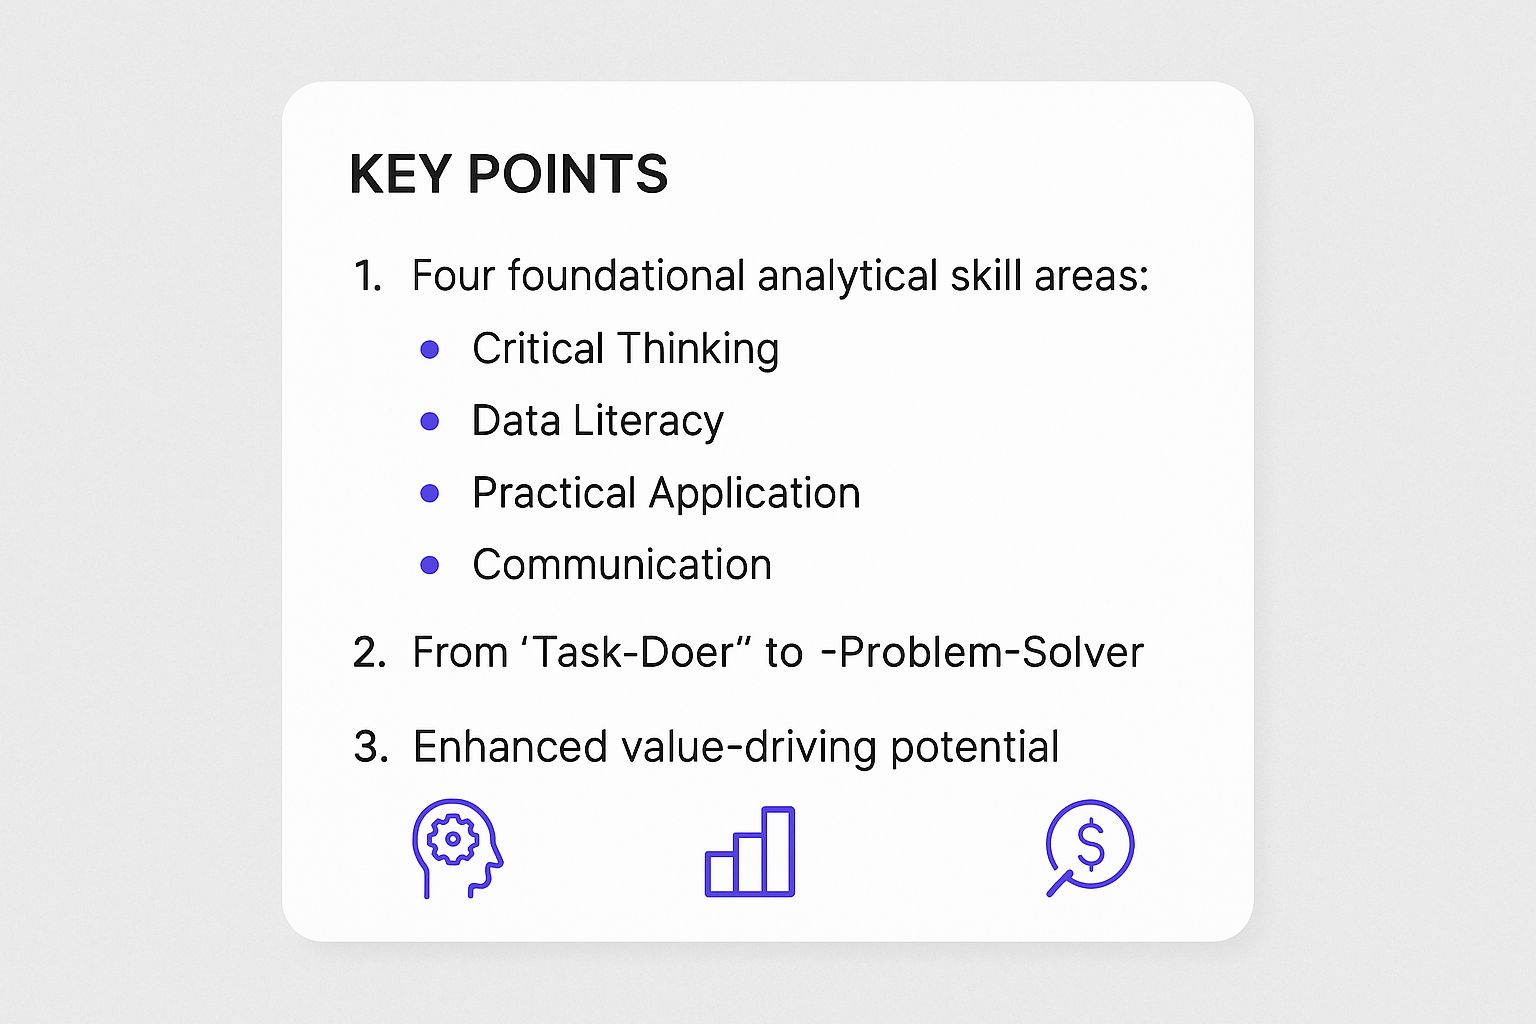
As you can see, the whole transformation is built on a foundation of better thinking, data interpretation, and communication. It's all about delivering more value.
Building a strong analytical foundation starts with understanding its core components. The table below breaks down the four key pillars that support all analytical work.
The Four Pillars of Analytical Skill Development
| Pillar | What It Means | First Actionable Step |
|---|---|---|
| Critical Thinking | Questioning assumptions and evaluating arguments objectively. | For the next week, before accepting any information, ask yourself: "What evidence supports this?" and "What's the counter-argument?" |
| Data Literacy | Understanding how to read, interpret, and find meaning in data. | Pick a simple dataset (like your monthly spending) and try to identify three interesting trends or patterns. |
| Practical Application | Using your insights to solve real, tangible problems. | Identify a small, recurring problem at work or home and brainstorm three potential solutions based on your observations. |
| Effective Communication | Translating complex findings into clear, compelling stories. | The next time you explain an idea, try to structure it as a simple story: What was the problem? How did you analyze it? What's the solution? |
Mastering these pillars is the first step toward becoming a more effective, strategic thinker.
Tangible Career Benefits
Putting in the effort to build these skills pays off in very real ways. Professionals who can break down tricky situations and present logical solutions are always more valuable. Here’s what that actually looks like day-to-day:
- Better Decision-Making: You can confidently weigh the evidence, look at different options, and pick the best path forward.
- Increased Efficiency: You'll start spotting bottlenecks and clumsy processes, allowing you to suggest fixes that save everyone time and money.
- Enhanced Problem-Solving: You become the person people turn to for tough challenges because they know you can break them down and figure them out.
- Greater Influence: When your ideas are backed by data and solid logic, people listen. Your recommendations start to carry real weight with your team and leaders.
At the end of the day, strong analytical abilities let you contribute at a much higher, more strategic level. That makes you indispensable—and it’s the fastest way to move your career forward.
Build Your Foundation in Critical Thinking
You can't really analyze what you don't truly see. This is where most people get it wrong. They jump straight to data and spreadsheets, but powerful analytical skills are actually built on a solid foundation of critical thinking—the simple habit of questioning information instead of just accepting it at face value.
Think of it as a mental muscle. The goal is to move past surface-level observations and start digging for what's really going on underneath. Before you can spot trends or solve a tricky problem, you have to get good at taking information apart. It’s about making analysis an instinct, not a chore.

Question Everything You Encounter
Your first move? Adopt a mindset of healthy skepticism. When you see a news headline, get a project update from a coworker, or hear a statistic thrown around in a meeting, your default response should be curiosity, not a nod of agreement.
Here are a couple of simple exercises you can start doing today:
- Deconstruct a News Headline: Look at a headline and ask yourself, "What's the angle here? What are they emphasizing, and more importantly, what are they leaving out?" This is a great way to train yourself to spot framing and bias.
- Analyze an Advertisement: Next time an ad pops up, break it down. Who are they trying to reach? What emotional buttons are they pushing to get you to buy?
This habit of active questioning forces you to slow down and prevents you from jumping to a conclusion based on half-baked or biased info. It’s the first real step.
The point of being a critical thinker isn't to be negative. It's to be precise. You're simply demanding clarity and evidence to make sure any conclusion is built on solid ground.
Master the 5 Whys Technique
One of the most powerful (and easiest) tools you can use is the "5 Whys" technique. It’s a dead-simple method for getting to the root cause of a problem instead of just treating the symptoms. You just keep asking "Why?"
Let’s take a common workplace headache: a project report was delivered late.
- Why was the report late? Because we didn't get the final data on time.
- Why wasn't the data available? The marketing team hadn't wrapped up their analysis.
- Why hadn't they finished? One of their key analysts was out on unexpected leave.
- Why did that stop everything? Because she was the only one who knew how to use the new analytics software.
- Why was she the only one trained? There was no budget approved for training the rest of the team.
Boom. What looked like a simple "late report" problem is actually a much deeper issue of poor resource planning and a single point of failure. That's the power of digging. A huge part of this is deductive reasoning, which you can sharpen with logic puzzles and brain teasers. You can even test and improve your deductive reasoning skills with online tools.
Apply Critical Thinking to Real Scenarios
Let's put this into a real-world business situation. Say your boss asks you to analyze a competitor's new marketing campaign. Someone with weak analytical skills might just comment on the colors and the slogan. A critical thinker, on the other hand, breaks it down.
- What's the real message? Are they selling a product, a lifestyle, or a solution to a very specific problem?
- Who are they talking to? Check out the language, the images they use, and where they're running the ads. That tells you everything about their target audience.
- Where are the weak spots? Does their message actually match their product's reputation? Are they making promises they can't possibly keep?
This kind of structured breakdown turns a vague task into a clear analytical exercise. You end up with real insights, not just random observations. This skill is so vital that 70% of Fortune 500 companies now have programs to develop it, sometimes offering 40–60 hours of annual analytical training to their people.
By practicing these techniques over and over, you'll find that questioning things and getting to the root cause becomes automatic. This foundation is a massive advantage, especially if you're trying to figure out how to get hired with no experience, because it shows employers you know how to think, not just what to do.
Learn to Speak the Language of Data
If critical thinking is the foundation, then data is the language modern professionals use to tell stories and make decisions. The word "data" often conjures images of intimidating spreadsheets and complex code, but it really doesn't have to be that scary.
At its heart, data literacy is just the ability to read, understand, and communicate information. You don't need to become a statistician overnight. It’s about learning to ask the right questions when you see a set of numbers. This skill is no longer a "nice-to-have"—it's a must-have, and the demand for data-savvy people is exploding.

The market is scrambling to keep up. Just look at the educational trends. In the U.S. alone, enrollment in data science and analytics bootcamps shot up by 52% between 2020 and 2022. It's a similar story in India’s tech scene, where 35% of universities have rolled out analytics programs to meet industry demand. You can dig into more of these trends in the full 2022 coding bootcamp report.
Your First Steps in Data Analysis
When you first open a new dataset, it’s easy to get lost in the weeds. The key is to start simple and look for the story hidden in the numbers.
Here’s a basic framework that has always worked for me:
- Spot the Trends: First, just look for patterns over time. Is a number consistently going up, down, or staying flat? Identifying that general direction is your first big clue.
- Investigate the Outliers: An outlier is any data point that just looks… weird. It’s way higher or lower than everything else. Ask yourself: Why? Is it a typo, or does it signal something really important happening?
- Question the Relationships: This is where you can avoid the biggest rookie mistake. Just because two things happen together (correlation) doesn’t mean one caused the other (causation). Think about it: ice cream sales and shark attacks both rise in the summer, but one doesn’t cause the other. The hidden factor is the warm weather.
The goal isn't just to see the numbers; it's to understand the context behind them. Every dataset tells a story about people, processes, or performance. Your job is to become a good storyteller.
To get started, it helps to know what skills to focus on. Here are the absolute basics you'll need.
Essential Data Literacy Skills for Beginners
| Core Skill | Simple Explanation | Tool or Method to Practice |
|---|---|---|
| Data Collection | Knowing where to find and gather reliable information. | Explore Kaggle for public datasets on any topic imaginable. |
| Data Cleaning | Tidying up your data by fixing errors, removing duplicates, and handling missing values. | Use the "Remove Duplicates" and "Find and Replace" functions in Google Sheets or Excel. |
| Basic Calculation | Using simple math (averages, sums, percentages) to summarize data. | Practice with formulas like =AVERAGE(), =SUM(), and =COUNTIF() in any spreadsheet software. |
| Data Visualization | Turning numbers into charts and graphs to make them easier to understand. | Create bar charts, pie charts, and line graphs using the "Insert > Chart" feature in Google Sheets. |
Mastering these four areas will give you a solid foundation for any data-related task.
Where to Find Data for Practice
Theory is great, but nothing beats getting your hands dirty with real data. You don’t need a fancy corporate login; the internet is packed with free, high-quality datasets perfect for practicing.
- Google Dataset Search: This is exactly what it sounds like—a search engine for datasets. You can find information on everything from public health to video game sales.
- Kaggle: A huge community for data scientists, Kaggle hosts a massive library of public datasets. The best part? You can see how other people analyzed the same data to get ideas.
A Practical Example with Google Sheets
You really don't need expensive software to start. A simple tool like Google Sheets is more than enough for your first few projects.
Let's walk through a quick, real-world scenario. Imagine you have a spreadsheet of customer feedback with two columns: "Rating (1-5)" and "Comment."
- Gather Your Data: First, just get your feedback into a Google Sheet. If you were analyzing your job hunt, you could import data from a job search tracking spreadsheet to see which application strategies are working best.
- Calculate Basic Metrics: Use simple formulas to get a quick snapshot. The
=AVERAGE()formula will instantly tell you the average customer rating, giving you a baseline. - Sort and Filter: Use the "Data > Sort range" feature to organize your ratings from lowest to highest. This is a game-changer—it immediately clusters all your negative feedback, making it easy to spot common complaints.
- Create a Simple Chart: Highlight the "Rating" column and go to "Insert > Chart." A simple pie chart or bar graph can instantly show you the distribution of ratings.
In just a few minutes, you’ve gone from a raw list of comments to a clear, actionable insight. You can now confidently say, "Our average rating is 3.8, but 20% of our feedback is negative, and the most common theme is slow response times."
That, right there, is the power of data analysis.
Put Your Analytical Skills Into Practice
Knowing the theory is one thing, but true analytical skill is forged in the fire of real-world problems. It’s the difference between reading about how to spot trends and actually digging into a messy dataset to find a game-changing insight yourself.
This is where you shift from learning to doing. Getting your hands dirty with practical projects doesn't just sharpen your mind; it builds a portfolio of work you can show off. Whether it's in a performance review or a job interview, you can point to tangible results and prove you know how to turn concepts into action. That's what employers are really looking for.
Start a Mini-Project in Your Current Role
You don't need to launch a massive, company-wide initiative to get started. The best way to build your analytical muscle is to start small and apply it to problems you already deal with every day. Just look for opportunities right in your own backyard.
For example, if you're a marketing professional trying to boost website engagement, a simple, focused analysis of your company's own traffic data is the perfect place to begin.
Marketing Project Idea: Content Performance Analysis
- Grab the Data: Pull the last three months of traffic data from your website's analytics platform. Focus on your blog and export key metrics like page views, time on page, bounce rate, and traffic source for each post.
- Find the Patterns: Sort the data to see what’s working and what isn’t. Are there common themes in your top-performing articles? Maybe case studies get more engagement, or listicles have a lower bounce rate.
- Form a Hypothesis: Based on what you found, make an educated guess. For instance: "Our audience responds better to how-to guides than to opinion pieces, shown by a 30% higher average time on page."
- Suggest Improvements: Come up with three specific, data-backed ideas. You could propose updating an underperforming post, creating more content on a hot topic, or targeting a traffic source that brings in dedicated readers.
An exercise like this elevates you from a content creator to a content strategist, someone who uses data to make smart decisions.
Tackle an Operations or Workflow Challenge
Analytical skills aren't just for marketers. They are absolutely critical in operational roles where efficiency is everything. Spotting and eliminating bottlenecks is the name of the game, and you can apply the same project-based approach to your team's workflow.
Operations Project Idea: Workflow Bottleneck Analysis
- Map the Process: Pick a task you do all the time, like onboarding a new client. Write down every single step from start to finish. Be detailed!
- Time Each Step: For one week, track how long each step takes. A simple spreadsheet or a timer on your phone works perfectly. You need this data for an objective look.
- Analyze the Data: Find the step that eats up the most time or causes the most delays. That’s your bottleneck. Is it waiting for approvals? Manually copying info between systems?
- Propose a Fix: Brainstorm one or two concrete changes. Could a template speed up data entry? Would a dedicated Slack channel get approvals faster?
When you present this kind of analysis, it shows you're not just a task-doer—you're a system-improver. Plus, having this kind of story in your back pocket is fantastic prep for behavioral questions, so be sure to practice for your next job interview.
Use Public Datasets for Broader Practice
Ready to stretch your skills beyond your day job? Dive into the world of public datasets. Platforms like Kaggle offer thousands of free datasets on literally any topic you can imagine, from movie ratings to global economic trends.
Each dataset is a self-contained world of questions waiting to be answered. It's the perfect sandbox to practice your analytical techniques without any professional risk.
The real value of these practice projects is the story they help you tell. You can confidently say, "I noticed a problem, I analyzed the data, I found an insight, and I proposed a solution." That narrative is infinitely more powerful than just listing "analytical skills" on a resume.
Communicate Your Findings with Impact
An insight is completely worthless if it stays buried in a spreadsheet.
After all that hard work—questioning assumptions, digging through the data, and finding the patterns—the final, most critical step is sharing what you've found. You have to do it in a clear, persuasive, and memorable way. This is where analysis turns into action.
Honing your analytical skills means becoming more than just a thinker; you have to be a great communicator, too. The real goal is to guide your audience, whether it's a single executive or an entire team, on the same journey of discovery you took. When you can lead them logically to your conclusion, you stop being an analyst who just provides reports and start becoming a leader who drives decisions.

Master the Art of Data Storytelling
The most effective way to present your findings isn't as a dry list of facts, but as a compelling story. Data storytelling isn't about making things up. It’s about giving your analysis a clear beginning, middle, and end that connects with your audience.
Here’s a simple structure you can adapt for any presentation:
- Set the Scene (The Problem): Kick things off with the context. What was the business question you were trying to solve? Why did it matter in the first place?
- Build the Tension (The Analysis): Walk them through the key steps of your process. What data did you look at? What surprising things or dead ends did you find along the way?
- Reveal the Climax (The Insight): This is your "aha!" moment. What was the single most important discovery you made? State it clearly and concisely.
- Propose the Resolution (The Recommendation): Based on your insight, what should the business do next? Make sure your recommendations are specific, actionable, and tied directly to what you found.
This approach transforms a dry data dump into an engaging journey, making your conclusions feel both logical and inevitable.
Choose the Right Visuals for Your Message
Data visualization is a powerful tool, but it's often misused. A complex, flashy dashboard can sometimes obscure your message more than clarify it. The trick is to choose the simplest visual that effectively communicates your point.
Your goal with any chart or graph is not to show all the data, but to highlight the single most important takeaway. Less is almost always more.
Think about the one thing you want your audience to understand, and then pick a visual that does that one job perfectly.
- Comparing values across categories? A simple bar chart is your best friend. It’s clean, easy to read, and everyone gets it.
- Showing a trend over time? A line chart is the clearest way to illustrate progress, growth, or decline.
- Breaking down parts of a whole? A pie chart or stacked bar chart can work, but only use it for a few categories to avoid a cluttered mess.
- Highlighting one powerful number? Sometimes, the best visual is no chart at all. Just displaying a large, bold number (like "45% Increase in Q3") can have the most impact.
Always label your axes clearly, use color to draw attention to the important stuff, and give your chart a descriptive title that tells people exactly what they're looking at.
A Real-World Presentation Scenario
Let's get practical. Imagine you’ve analyzed customer churn data and found that customers who don't use a key feature within their first week are 80% more likely to cancel. Now you have to present this to a busy executive who has five minutes.
Here’s how you’d handle it:
- Lead with the Punchline: Don't bury the lede. Start with a clear, impactful statement like, "I've discovered the single biggest driver of our customer churn. We're losing people who don't engage with Feature X in their first seven days."
- Show the Proof with One Simple Chart: Back it up with a clean bar chart comparing the churn rate of users who used the feature versus those who didn't. The visual contrast will make your point instantly.
- Provide a Clear Recommendation: Translate your insight into action. Suggest something concrete, like, "I propose we launch a targeted onboarding email on day three to drive all new users to this specific feature."
By boiling down your complex analysis into one key takeaway, one simple visual, and one actionable recommendation, you make it easy for decision-makers to get it, agree, and give you the green light. This is how strong analytical skills create real business impact.
Common Questions About Analytical Skills
Whenever you set out to build a new skill, a bunch of questions pop up. It’s only natural. Getting a handle on the common roadblocks and myths can help you set realistic goals and keep you moving in the right direction. We’ve rounded up some of the most common questions we hear to give you some clear, no-nonsense answers.
How Long Does It Take to Develop Strong Analytical Skills?
There’s no magic number here. Think of it less like a project with a deadline and more like getting in shape. You don't just "finish" getting fit, and you don't just "finish" learning to be analytical. It's an ongoing process.
But that doesn't mean you won't see results quickly. With steady, focused practice, you’ll notice a real difference in just a few months.
The key is consistency, not intensity. Putting in 3-5 hours a week working on targeted exercises—like breaking down arguments or playing with small datasets—is far more effective than a marathon cramming session on a weekend. The goal is to weave these practices into your regular routine.
- Foundational Skills (Weeks to Months): You can sharpen your critical thinking and get better at questioning assumptions pretty fast.
- Technical Skills (Months to a Year): If you're looking to master specific tools like SQL or Python for data analysis, that’s going to require a bigger time commitment.
It’s a lot like learning a new language. You can get to a conversational level in a few months, but true fluency is something you work on for life.
Do I Need to Learn Coding to Have Good Analytical Skills?
Not necessarily, but it definitely gives you superpowers. At its core, being analytical is about a way of thinking—breaking down problems, seeing patterns, and making logical leaps. You can be an incredibly sharp analyst with nothing more than Excel, Google Sheets, or even just a pen and paper.
But learning to code opens up a whole new level.
Coding languages like Python or SQL aren't just technical tools; they're powerful frameworks for structured thinking. Learning them forces you to be precise, logical, and systematic—all hallmarks of a great analyst.
It really comes down to your career goals. If you see yourself wrangling massive datasets or automating complex reports, then yes, coding will become essential. But if your work leans more toward qualitative analysis or big-picture strategy, you can build a powerful skillset without ever writing a line of code. My advice? Start with the thinking process first, then pick up coding if and when your path demands it.
What Are the Best Ways to Showcase Analytical Skills on a Resume?
This is a big one. Just sticking "strong analytical skills" in your skills section is a huge mistake. It's a cliché that tells a recruiter absolutely nothing. You have to show, not tell. The best way to do this is by weaving proof of your skills directly into your experience bullet points.
The STAR method (Situation, Task, Action, Result) is your best friend here. Use it to frame your accomplishments and, whenever you can, slap a number on it.
Just look at the difference:
- Weak: "Analyzed sales data to find trends."
- Strong: "Analyzed quarterly sales data (Action) to pinpoint underperforming product lines (Task), which led to a new marketing strategy that boosted regional sales by 15% in six months (Result)."
See? The second one provides cold, hard proof that you can turn analysis into actual business value. For extra credit, you can link to a portfolio of personal projects on a personal website or GitHub to give hiring managers a direct look at what you can do.
Can Creativity and Analytical Skills Coexist?
Absolutely. In fact, they're two sides of the same problem-solving coin. The most brilliant solutions almost always come from a mix of logic and imagination. These skills don't compete; they complete each other.
- Analysis defines the problem. It's how you break down a messy situation, figure out what's really going on, and identify the root cause with data. It answers the "what."
- Creativity generates the solution. It's the spark that helps you brainstorm innovative, out-of-the-box ways to tackle the problem you just defined. It answers the "how."
Think about it this way: an analyst might use data to discover that customer churn is highest in a specific demographic. That's the logical part. The creative part is dreaming up entirely new marketing campaigns or product features specifically designed to win that group back.
Ready to stop juggling spreadsheets and start landing interviews faster? With Eztrackr, you can manage your entire job search in one place, from saving jobs with a single click to crafting perfect, AI-powered application materials. Join over 45,000 job seekers who trust our tools to stay organized and get ahead. Take control of your career journey today at https://eztrackr.app.