ATS Stats 2026: Key Metrics, Benchmarks and Tracking
In structured interviews with 25 U.S. recruiters in September and October 2025, 92% said their systems didn't automatically reject applicants based on resume format or content, according to recruiter interviews published by AIJourn. That single figure reframes most ATS stats you'll read. Software rarely acts as an instant executioner. It parses, sorts, ranks and routes, while knockout questions and recruiter capacity do much of the actual eliminating. If you don't separate those stages, you'll blame a font for a silence that was really about eligibility, ranking position or sheer application volume.
ATS Statistics at a Glance
Nearly every large employer runs an applicant tracking system. In 2025, an ATS was detected on 489 of the 500 Fortune 500 company career pages, representing 97.8%, according to Jobscan's annual ATS audit as reported by HeroHunt. The remaining 11 companies aren't proof of a manual process. They may run proprietary or undetectable systems, so 97.8% is best read as a floor for detectable technology, not a precise count of every automated workflow.
How to Read These ATS Stats
Check the year and the sample before you quote any figure. A detection audit of 500 career sites, a scan of thousands of resumes and interviews with 25 recruiters answer different questions, and none of them predicts what'll happen to your next application.
| Metric | Figure | Year | What it signals |
|---|---|---|---|
| ATS detected on Fortune 500 career sites | 489 of 500 (97.8%) | 2025 | Near-universal use among the largest employers |
| Recruiters with content-based auto-rejection | 8% of 25 interviewed | 2025 | Format and content rarely trigger automatic rejection |
| Recruiters using knockout questions | All 25 interviewed | 2025 | Binary eligibility checks are standard |
| Resumes with formatting problems | 62% of 2,417 scans | 2026 | Parsing risk is common, not rare |
| Average job-specific match score | 58/100 | 2026 | Most resumes have room to improve keyword alignment |
| HR leaders planning ATS investment | 50% | 2025 | Demand for ATS platforms is still growing |
| Global ATS market size | Approximately USD 2.7 billion | 2024 | Commercial scale of the category |
Two rows deserve extra caution. The recruiter figures come from 25 structured interviews, so 8% means two people in that sample, not a stable industry rate. The resume figures come from one scan dataset of 2,417 resumes, so they describe documents people chose to check, which may skew toward candidates already worried about compatibility.
Read the knockout row differently. All 25 recruiters using eligibility questions is a stronger signal than any percentage drawn from a small sample, because it describes a standard workflow step rather than an opinion.
Reading rule: A benchmark tells you what's common in a sample. It doesn't tell you why one specific application stalled.
Treat this table as directional. It separates three things people usually lump together: automatic rejection, which the interview data suggests is rare; eligibility screening through knockouts, which is universal in that sample; and the ranking and volume pressures that sit downstream of both. That distinction should decide where you spend your editing time.
How Widely Employers and Markets Use ATS
An ATS works like a filing system that learned to sort. Early products stored resumes and tracked candidates in place of paper files and scattered spreadsheets. Cloud pricing later put searchable databases and shared workflows within reach of smaller employers that would never have bought enterprise software.
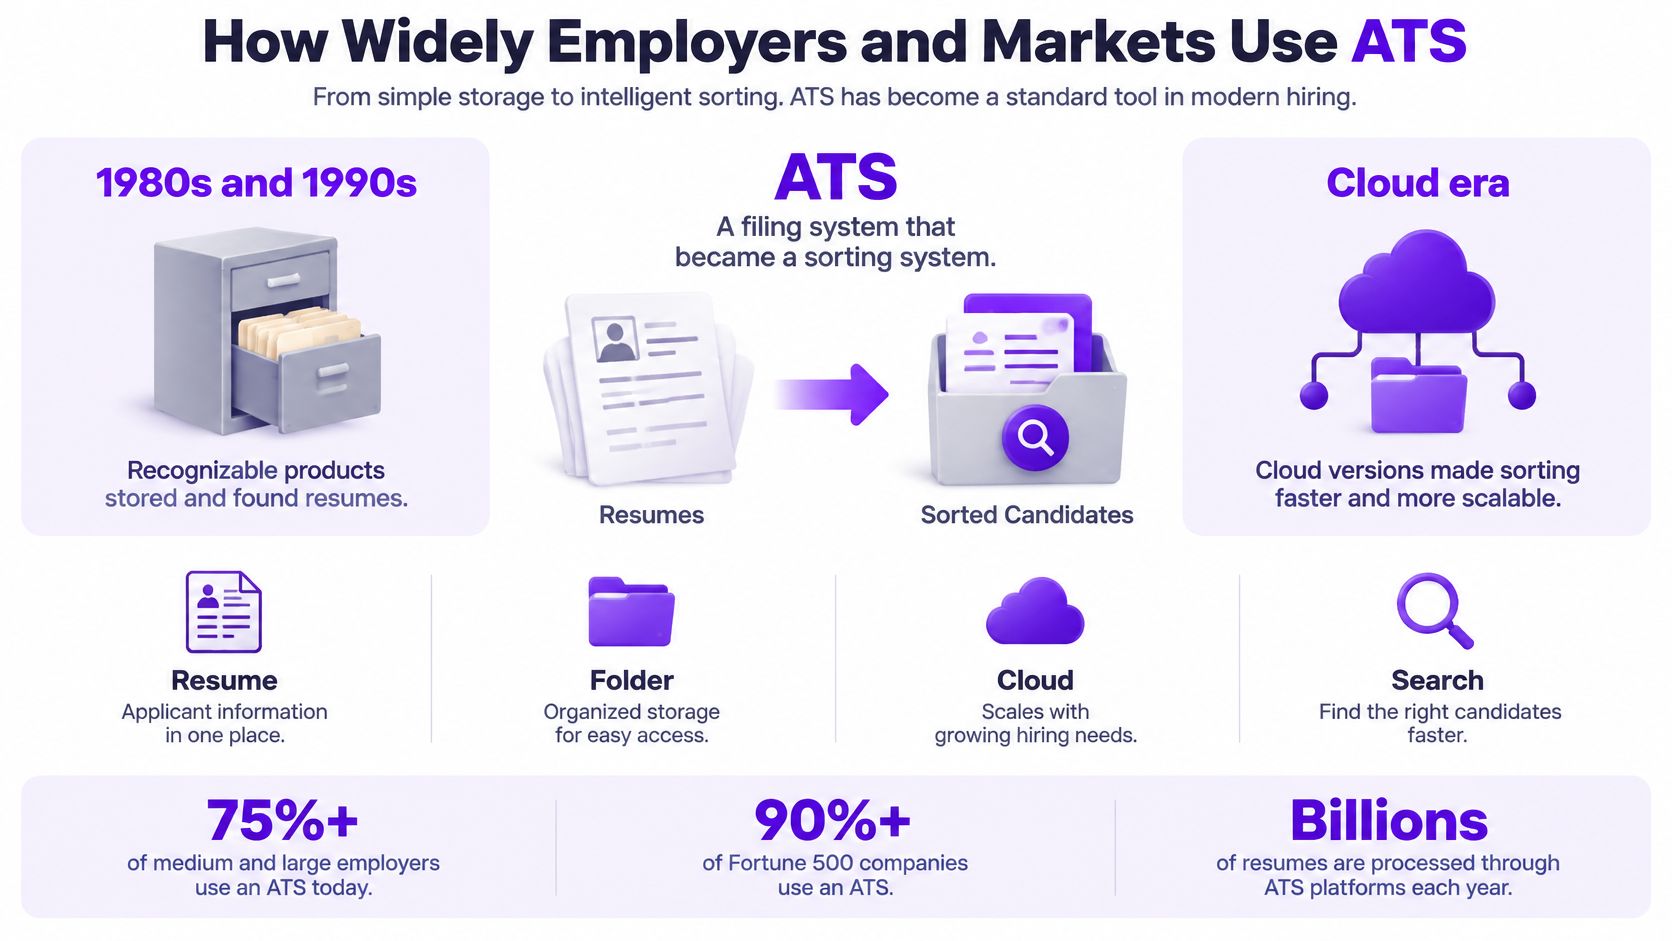
Adoption follows volume more than fashion. When a large employer receives thousands of applications for one role, recruiters cannot coordinate screening criteria, interview notes and candidate emails from individual inboxes. They need one searchable record, standardized stages and shared communication, and that is the product modern platforms sell, from application intake through funnel reporting.
What the Money Confirms
The category is already at commercial scale: the global applicant tracking system market was about USD 2.7 billion in 2022 and is projected to reach about USD 4.1 billion by 2030, according to a Research and Markets market report. Investment intent points the same way, since 50% of surveyed U.S. HR recruiters and managers planned to direct investment toward ATS platforms in 2025, according to Employ's Recruiter Nation research summarized by ExecSearches.
Adoption now stretches across borders and hiring models, including distributed teams. If you're building a remote pipeline and want to Hire talent from Latin America, those candidates still pass through the same parsing, eligibility checks and ranking steps as local applicants. Geography changes the talent pool, not the infrastructure.
For job seekers, the useful conclusion is narrower than "the software rejected me." Assume software sits between submission and a human reader at large employers, but separate what it does: it parses, applies knockout eligibility rules, ranks results and gives recruiters a queue when volume is high. If you pull postings from several boards, keep intake consistent by connecting your tracker to job board sources so the original description stays attached to each application. Then spend the heaviest tailoring on high stakes roles where the match is close.
Resume Parsing Failure Rates by Platform
Parsing is the stage where formatting can hurt you, because the system has to extract text before anyone can search or rank it. A 2026 study of 2,417 anonymized scans reported formatting problems in 62% of resumes and an average job-specific match score of 58/100, according to the 2026 ATS resume study from ATSChecker. Those two numbers belong together. If ingestion drops part of your experience or skills, any later match score is grading an incomplete document.
| ATS platform | Reported parsing failure rate | Main failure trigger |
|---|---|---|
| Oracle Taleo | 34.1% | Two-column layouts and tables in several enterprise systems |
| Workday | 28.3% | Two-column layouts and tables in several enterprise systems |
| Greenhouse | 12.4% | Nonstandard formatting that blocks clean text extraction |
| Lever | 11.2% | Image-based content and nonstandard formatting |
Why Enterprise Systems Carry More Risk
The pattern in the table is uncomfortable. The platforms with the highest reported failure rates, Oracle Taleo at 34.1% and Workday at 28.3%, are enterprise systems used by large employers. The lower rates, Greenhouse at 12.4% and Lever at 11.2%, come from platforms common at smaller and mid-sized companies. So the bigger the employer, the less forgiving you should assume the parser is.
The triggers are consistent. Two-column layouts and tables scramble reading order, so a skills sidebar can get merged into the wrong job entry. Image-based text, icons carrying contact details and headers or footers holding key information can vanish entirely because there's no selectable text to extract.
A polished PDF that a parser reads out of order is worse than a plain document it reads completely.
Fixes That Work on Every Platform
- Single-column layout: Keep one reading path so dates, titles and bullets stay attached to the right role.
- Conventional section labels: Use headings like Experience, Education and Skills that parsers expect, following a resume format built to pass ATS parsing.
- Selectable text: Export from a text document, then copy and paste your own PDF into a plain editor to confirm nothing disappears.
- Description wording: Name skills the way the target job description names them, where that's truthful.
One caveat before you act on the ranking. These rates come from a single study with its own test resumes and configuration choices, and employers configure the same platform differently. Read the table as a risk gradient, not a guarantee about any specific company's setup.
Reading Precision, Recall and Other Screening Metrics
Screening works like a fishing net. Recall asks how many of the fish worth keeping made it into the net. Precision asks how many of the fish in the net were worth keeping. A wider net misses fewer good fish, and it also hauls in more you have to throw back.
The visual below pairs that net idea with the funnel recruiters work through.

Benchmarks From One AI Screening Study
A 2025 benchmark of an AI resume screening method reported 85% accuracy, 78% recall and an 81% F1 score, with approximately 0.5 seconds of processing per resume, according to the 2025 benchmark study in the VMRF institutional repository. At that pace the system screens several thousand resumes per hour, far beyond what any recruiting team reads manually.
| Metric | What it measures | Reported benchmark |
|---|---|---|
| Accuracy | Share of screening decisions that are correct | 85% |
| Recall | Share of genuinely relevant applicants who survive screening | 78% |
| Precision | Share of selected applicants who are actually relevant | Older ATS baseline about 75% |
| F1 score | Balance between precision and recall | 81% |
| True-positive rate | Relevant applicants correctly selected | 88% |
| False-positive rate | Irrelevant applicants wrongly selected | 10% |
| Processing speed | Time per resume and throughput | About 0.5 seconds (several thousand resumes per hour) |
| Older ATS recall | Relevant applicants kept by older approaches | About 70% |
Read two rows with care. The true-positive rate of 88% and recall of 78% describe the same underlying idea, relevant applicants who survive, computed differently in that study, so counting them as two separate wins inflates the result. Older approaches at roughly 70% recall also put the newer figure in perspective. Even the better method still misses a meaningful share of relevant people, which is why configuration matters so much in how applicant tracking systems actually work.
This walkthrough shows how screening scores get produced before a recruiter ever opens a profile.
The Trade-Off You Can Use
Broadening keyword matching raises recall and lowers precision at the same time. Add loosely related terms and more borderline resumes surface, including yours, while recruiters wade through more noise and may tighten filters later. That's why stuffing a resume with every synonym backfires.
Keep one distinction straight. A score orders a queue. The metric itself rejects nobody, and a 78% recall rate describes a population of screened resumes rather than the fate of any single application.
Analyst check: For any screening statistic, ask which population the rate is computed over and which error the system chose to accept.
For your own search, the useful translation is this. A match score is closer to a recall tool. It estimates whether you'd surface in a recruiter's search, and it says nothing about your odds of getting hired. Your interview conversion is the number that grades your strategy.
Why Applications Get Rejected Through Knockouts, Ranking and Volume
An application can stop at an eligibility question, fall below a recruiter's review cutoff, or wait in a crowded queue. These are different outcomes, and silence alone does not show which one happened.
In 25 structured U.S. recruiter interviews conducted in September and October 2025, 8% of recruiters had configured content-based auto-rejection. The same study reported that all 25 used knockout questions for binary eligibility, such as work authorization, location, licensure or minimum education (AIJourn study). A form response can therefore end an application before anyone reviews the resume.
The Funnel in the Order You Meet It
| Cause | Where it happens | Evidence | Fix |
|---|---|---|---|
| Knockout question | Application form | All 25 recruiters interviewed used them | Answer eligibility fields accurately and completely |
| Content-based auto-rejection | ATS rule set | Configured by 8% of recruiters | Use the job's required terms when they accurately describe your skills |
| Parsing error | Resume ingestion | 62% of scanned resumes had formatting problems | Use a single-column, selectable-text resume |
| Ranking below cutoff | Recruiter queue sorting | High application volume can slow review and make it harder for lower-ranked applications to be seen | Tailor skills and keywords to each role |
| Post-submission silence | Recruiter capacity | High application volume can slow recruiter review; silence does not identify the cause | Track conversion rates, not single outcomes |
Knockouts act at the eligibility stage. A “no” to a required license or work authorization question can end an application before a recruiter sees it. Read each question carefully, including those about relocation or start dates, and answer accurately.
High application volume creates a different bottleneck. Recruiters must sort and prioritize the queue, so an application may receive little or no review even without an automatic rejection. Ranking affects visibility; it does not establish that a system rejected the candidate.
What You Can Actually Change
- Eligibility fields: Complete every required field and double-check yes or no answers before submitting.
- Required terms: Use the posting's wording for skills and credentials you hold.
- Application timing: Apply early in the posting window, before the queue grows.
- Silence: Treat no reply as an unknown outcome, not proof of machine rejection.
The research cited here does not establish a reliable rate for post-submission silence. Measure that outcome in your own application funnel instead, and compare it as you change targeting.
When an application goes nowhere, distinguish among a knockout response, a parsing problem, a low ranking and a queue that has not reached your application. Each points to a different possible cause; silence by itself cannot identify one.
Bias and Limits Behind a High Match Score
A high match score feels like objective good news. The evidence says treat it more carefully. Research summarized in a 2025 academic review reports that more than 90% of employers initially filter or rank middle- and high-skilled candidates using systems that can rely on proxies such as keywords, credentials and employment gaps, according to the 2025 academic review hosted on eScholarship.
Proxies are stand-ins. They correlate with past hiring patterns, which differs from measuring ability to do the job.
The dashboard view below is what that proxy-based ranking looks like from the recruiter's side.

Separate research on LLM-based resume comparisons found consistent favoritism toward white-associated names over Black-associated ones, along with a marked preference for male-associated names. A system trained on historical hiring data can therefore reward resemblance to previously hired profiles. If your score rises after edits, the gain may reflect closer conformity to those historical signals. Your qualifications stayed the same. Only the surface match moved.
Who This Hits Hardest
Career changers describe real skills in vocabulary from another industry, so keyword matching undercounts them. Immigrants may hold equivalent credentials under unfamiliar names. People with employment gaps, older workers and anyone on a nontraditional path face the same structural problem, because the proxy rewards a standard trajectory. Reading job matching insights from GENTY recruitment helps here, since it separates genuine role fit from surface similarity to a posting.
Limits Worth Keeping
- Test each suggested keyword: Ask whether it names a task you'll perform, or only a phrase the posting repeats.
- Keep claims provable: Add a term only when you can discuss the work behind it in an interview.
- Interrogate a low score: It may expose narrow criteria in the posting rather than a weak candidacy.
- Compare by segment: Track career-change applications separately from closely matched ones, and see whether score gains produce interviews or just higher scores.
That segment comparison is the genuine test of optimization. When customized resumes raise your match score while the interview rate stays flat in one segment, the score is measuring conformity, and effort belongs elsewhere: referrals, direct outreach and roles whose criteria you can evidence plainly.
A match score feeds your judgment as one input among several. It cannot see your portfolio, your references or the context behind a gap. Where your evidence is strong, apply anyway.
How to Track ATS Performance Step by Step
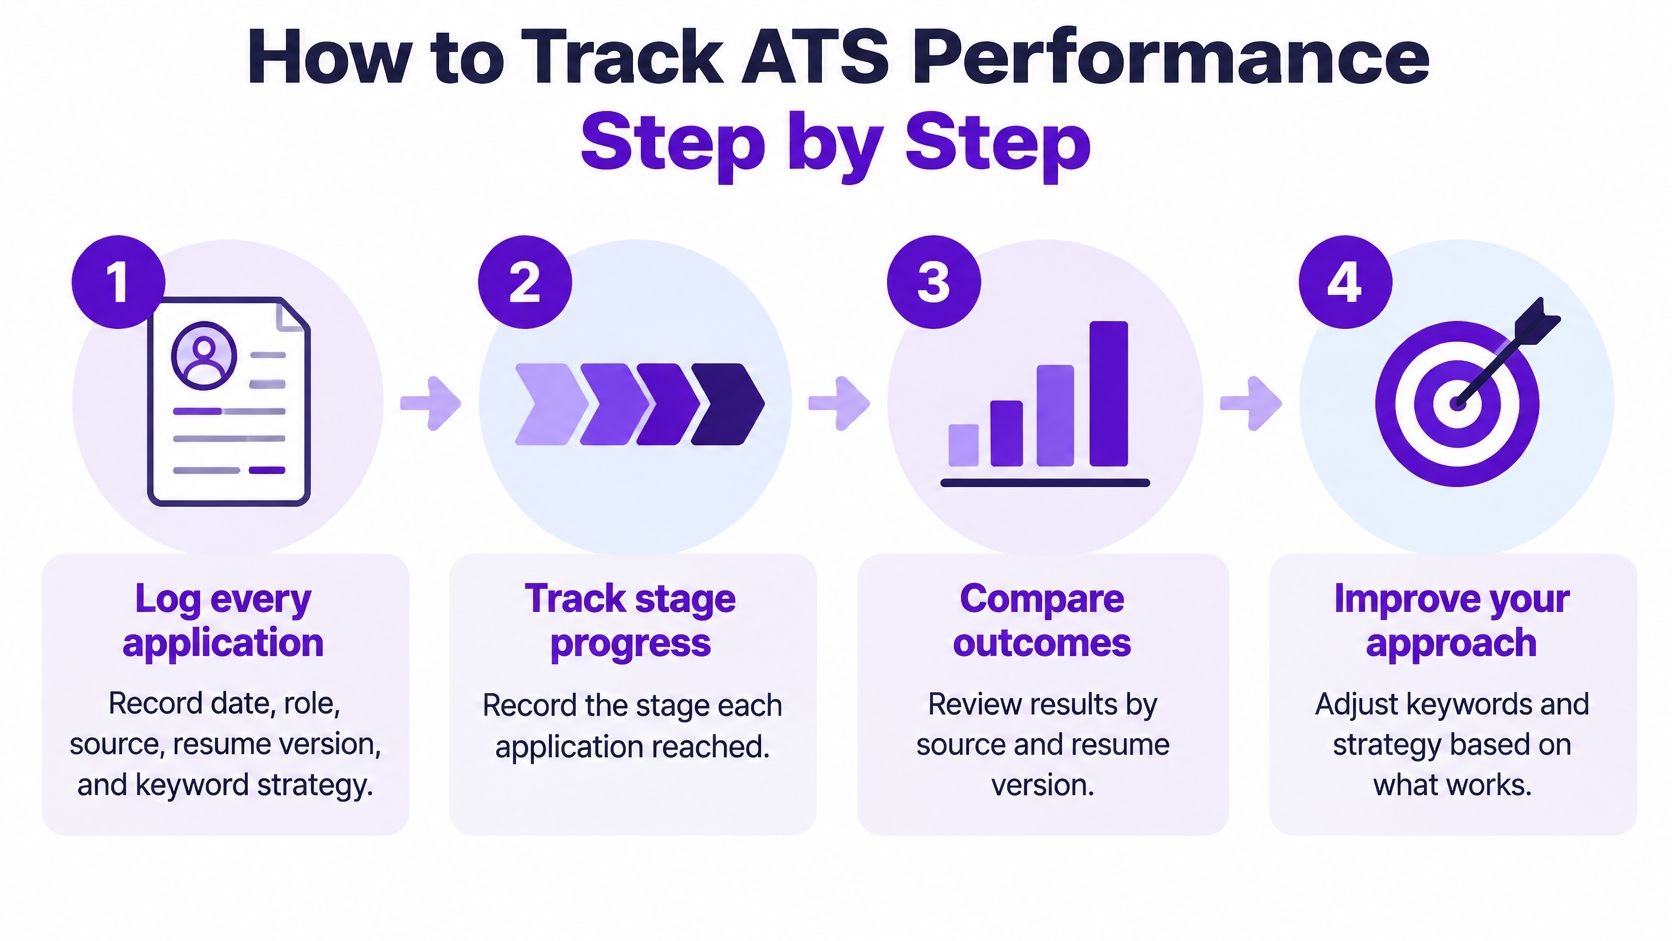
Published ATS stats describe other people's funnels. Your decisions need your own numbers, and those require a log you maintain from the first application, not a reconstruction from memory and inbox searches a month later.
The four-part flow below compresses the routine into its essential loop.
The Seven Step Routine
Log every application at submission. Record date, role, company, source, resume version and keyword strategy. Missing fields make later comparisons impossible, and you won't remember which version went where. Our Job Tracker for logging applications and stages exists for exactly this record keeping.
Record the furthest stage reached. Use submitted, screened, interviewed, offered or no response. Update the stage the day it changes, because stale stages can corrupt every rate you calculate later.
Calculate application-to-screen rate per resume version. Divide screens by applications for each version. Say version A produced 4 screens from 20 applications, a 20% rate in this example, while version B produced 1 from 20. That gap is a signal to investigate, not proof, at that sample size.
Calculate application-to-interview rate by role family and source. This shows where effort converts. Referrals, company career pages and job boards behave differently, and blending them hides which channel deserves more applications.
Flag knockout stops separately. When an application ends at an eligibility question, mark it and review your answer. A pattern here usually means you're applying to roles with a hard requirement you don't meet, or answering a question too narrowly.
Count silence on a fixed rule. Mark applications as no response after about two weeks without contact, and keep them out of your rejection count. Silence and rejection have different causes, so mixing them produces a conversion rate that explains neither.
Review every 30 days and change one variable. Swap one resume version or one keyword set, then hold everything else steady. Changing your resume, your target titles and your sources at once leaves you unable to credit any improvement.
The Mistake That Hides Everything
Mixing career-change applications with closely matched roles in one conversion rate guarantees a number that describes neither group.
Segment first, then compare. A useful trend is a rate that rises across several weeks within one segment and one resume version. One strong week is noise, especially when your weekly application count is small.
Also resist grading individual outcomes. A single rejection at a company that received a four figure applicant pool carries almost no information about your resume. Twenty applications with zero screens in a well matched segment carries a lot. Your tracker turns anecdotes into rates, and rates are what you can act on.
Benchmark Your Own Funnel This Month
One tracker should hold everything the routine above produces, each application's date, role, source, resume version, keyword strategy and stage. The Job Tracker gives you overall job hunt statistics and insights in one place, so you can read application volume and stage conversion together instead of rebuilding the picture in a spreadsheet every week.
Your 30 Day Test
Pick one resume version and commit to it for a month of applications in one role family. Before you start tailoring, use ATS keyword matching to see what a job description asks for, since it surfaces gaps in the resume and explains every change made. That explanation matters, because you should only accept edits you can defend in an interview.
Then measure two rates weekly and monthly, application-to-screen and application-to-interview. If you want a fuller method for the second one, you can track your application-to-interview rate against your own history rather than against a stranger's benchmark. Industry benchmarking also helps calibrate expectations, since it compares a resume against industry standards and top performers in your field.
How to Judge the Result
- Rising screen rate, flat interview rate: Your resume surfaces, but screening conversations or work samples aren't converting, so preparation is the bottleneck.
- Flat screen rate in matched roles: Revisiting parsing, section labels and keyword wording is worth another pass.
- Strong rate from one source: Shift application volume toward that source instead of spreading evenly.
- No movement anywhere: Question targeting before rewriting again, since role fit upstream beats keyword work downstream.
Remember what a benchmark is. The published figures you started with describe Fortune 500 career sites, scanned resumes and small recruiter samples. They're reference points for where risk lives, not targets your funnel must hit. A rate improving steadily in your own data is worth more than matching any headline number.
Do the concrete version of this today. Enter your last 20 applications into your tracker with their sources, resume versions and stages, then calculate your two conversion rates. You'll likely find one segment or source outperforming the rest, and that finding, not another generic ATS statistic, tells you where next month's applications should go.
Stop guessing which stage ended your applications and start measuring your own funnel, from parsing safe resumes to application-to-interview conversion by source and resume version. Eztrackr brings your job tracker, statistics dashboards and ATS keyword matching into one place, so every change you test shows up in your numbers. Visit today, log your recent applications and run your first 30 day benchmark.